Throughout my career, I keep hearing colleagues say that we want safe doctors. But they can’t tell me what a safe clinician is—there’s no robust definition. It’s a buzzword I see repeatedly used.
What I also see is the mentality of: “As long as they are ‘safe’, that is okay, and they can go on their merry way.” It becomes accepted that this person’s practice is fine even if they over-order every test, refer everyone, never take clinical risks, depend heavily on specialists, and practise algorithm-only medicine. Okay—they’re safe. But are they a critically thinking doctor? Is this the standard?
Because there is no shared definition, clinicians assume many things about what a safe clinician is. The concept becomes warped, and the following features emerge:
The “what-if” game gets played constantly—and then cognitive biases take hold. Catastrophising, blame avoidance, and regret avoidance emerge and drive the behaviours that follow.
Over-investigating—defensive, low-value testing that generates false positives or incidentalomas, creating more problems than it solves.
Referral bots—calling this person, then another person, then another person, and before you know it every surgical team has been involved.
Lack of clinical risk-taking—fear of litigation if a rare adverse event occurs as a result of a treatment decision is something I see often.
Specialist worship—“they said X, therefore X”, and never committing to their own decision-making.
The desire to not miss anything—and before you know it every test, scan, and specialist is involved.
Fear of litigation—which underpins a lot of the above features and I will reserve for another time
The perception of a “safe” clinician can become so distorted that it turns into a euphemism for someone who is conservative, defensive, and engaged in low-value practice.
I fell into these behaviours earlier in my career and sometimes still do. I haven’t had colleagues talk about it, nor have the specialists I work with really engaged with these issues directly. It has mostly been through indirect feedback. For instance, a consultant might say, “This is not likely, so we’re not going to do that. The evidence points towards this as the diagnosis. Therefore… such and such.” Years later, I wonder what we could introduce earlier so that, as a profession, we not only become cognisant of this, but are also given tools to diminish its grip on our practice.
In this wasteland, the A-type personality is very likely to be left behind and become deep-fried in the pursuit of being safe.
If we were to define what a safe clinician is, it would include the following features:
Utilises clinical reasoning to explain the decisions they are making
For instance, I am not performing blood tests or a chest X-ray in a 40-year-old woman with community-acquired pneumonia who has no vital sign abnormalities and a clear history and examination pointing to it. The diagnosis has been made clinically; antibiotics with appropriate safety-netting is sufficient care.
Recognises risk and responds appropriately
Using the previous case: it is now a 67-year-old man with haemoptysis and a smoking history. No other factors have changed. The clinical diagnosis still points towards community-acquired pneumonia; however, recognising the risk of complications and malignancy leads the clinician to order a chest X-ray.
In contrast, someone who doesn’t do this might send a vitally stable 70-year-old with a clinical diagnosis of CAP to the emergency department for a chest X-ray simply because it is the weekend—despite the person being fit and independent and having a strong safety net (e.g., their son lives with them).
Awareness of scope limitations
This is tricky—exploring the idea of conscious incompetence vs unconscious incompetence.
A strong follow-up system
This includes the safety-net we set for patients in general practice.
It also includes the education we provide on when to return for review—which requires placing appropriate trust in patients to do so.
And it includes systems for results follow-up, recalls, and handovers.
Communication
Professionalism—don’t be a dick
Cognitive bias awareness
A disappointingly under-appreciated aspect of being a safe clinician—and no one seems to really talk about it.
Responsiveness to feedback
We are all trying to grow as doctors—we want to be better.
Being defensive does not help.
Arguing, “This is just how they practise,” is also a terrible take.
We should not be arguing that doctors should be safe; we should be pursuing competence in our profession, combined with being calibrated to operate in a world of risk.
We want competent and calibrated clinicians:
Competent, based on sound knowledge and appropriate assessment
Calibrated, where the response matches the risk
If we change our wording about what we want from ourselves and our colleagues, with clearly defined parameters, we can avoid the pitfalls created by labelling ourselves as “safe”. What I want are clinicians who are competent, risk-calibrated, and make judicious decisions.
This is an undervalued area in general practice. The most common thing I see occur is we keep stacking on antihypertensives and treat the number to reduce the risk of cardiovascular disease. However, we often forget to ask the question, “Is there an underlying cause here?”
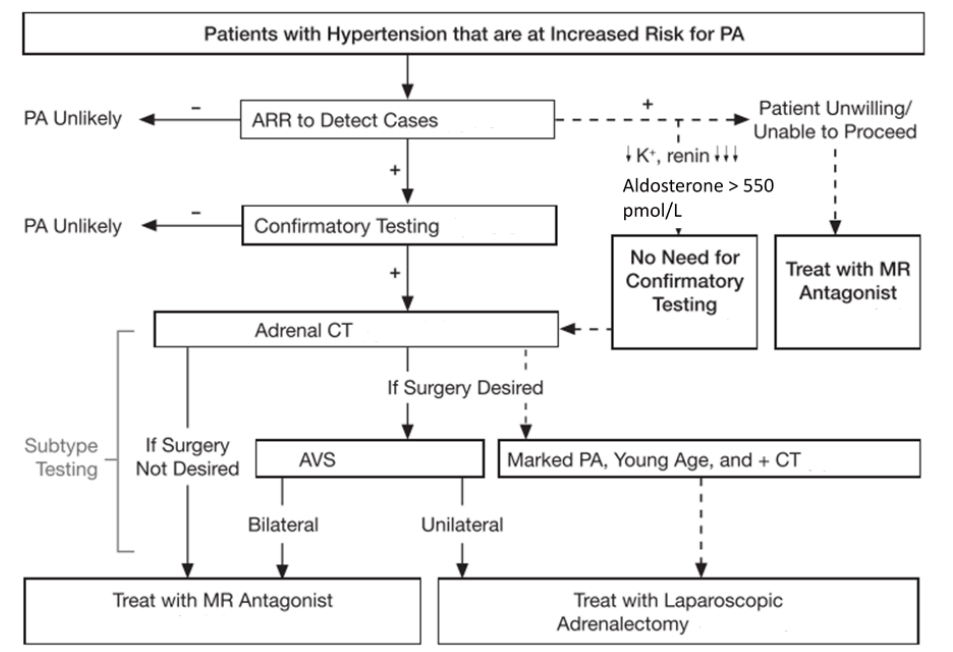
The purpose of this post is to get people thinking about secondary hypertension and flagging it early on top of guidance for Conn’s/primary hyperaldosteronism evaluation. We in general practice are able to identify these individuals with secondary hypertension and therefore provide the care required to reduce their risk of cardiovascular disease.
Incidence of secondary causes of hypertension
1 in 10 patients with hypertension have a secondary cause.
The most common presenting complaint in general practice is hypertension based on the BEACH data – 5.7% of problems encountered and 9 out of 100 encounters). I think we underappreciate these numbers.
The following factors make it even more likely a secondary cause is at play
Onset less than 40 years old
Abrupt onset
Abrupt worsening despite previously good control
Hypertensive urgency or emergency
Resistant hypertension (3 agents with diuretic = uncontrolled OR 4 or more agents needed)
Target organ damage that is disproportionate
Family history
Clinical clues – hypoK, SeCr >20% rise post ACEI/ARB, or paroxysmal HTN
In terms of prevalence in unselected hypertensive patients we need to think of the big 3
Obstructive sleep apnoea – 25%
Sleep study
Primary hyperaldosteronism – estimates range from 5 to 15%
Renin-aldosterone ratio in the setting of withholding medications that interfere with it’s measurement
Renovascular disease – 5% (parenchymal is much less at 1%)
renal function test combined with urine microalb:cr ratio with a urine MC&S
The clinical literature highlights that testing for these conditions first is reasonable given the incidence of them being the highest
Don’t forget the medications we throw patients on: SNRIs, stimulants, NSAIDs, COCP, nicotine, alcohol and more.
For other rare disorders we ought to be guided by the clinical picture which includes: Cushing’s syndrome (<1%), pheochromocytoma (<1%), aortic coarctation (<1%).
Several other rare causes are out there… such as the potassium wasting disorders. But I digress. Heck even licorice apparently in excess can cause hypertension.
So… I want to test for primary hyperaldosteronism – how do I do it?
Firstly, don’t do it if the risk of having uncontrolled hypertension in the 160s or more is likely to occur.
If we have a patient who we are confident we can do it for the Endocrine Society provide an excellent guide for testing that was formulated by the Endocrine Hypertension team at Hudson Institute of Medical Research. We need to do the aldosterone-renin ratio test.
Basic rule to withhold: diuretics (including MRAs) 6 weeks and everything else 2 weeks.
Then the testing can occur. Another really important aspect of it is making sure the patient’s potassium is greater than 4.0 – therefore replace it with slow K or chlorvescent.
The medications used to hold a person’s blood pressure under control are:
Medication
Dose
Initiation
Verapamil SR
180-240mg BD
90mg-180mg daily
Prazosin
0.5mg-5mg BD or TDS
0.5mg BD
Moxonidine
200-400microg daily
200microg nocte
Hydralazine
12.5-50mg BD
12.5mg BD
Hydralazine can go up to 300mg per day – however over 200mg is asking for trouble. Beyond 200mg, 1 in 10 patients can get hydralazine-induced lupus-like syndrome which can be delayed.
I often find verapamil with prazosin first is the combination I’m favouring – prazosin sometimes can induce tachycardia and verapamil offsets it.
I also give a fact sheet for patients because the following things need to occur
The patient must have a medication management plan as above with the GP or specialist
The patient must stop any NSAIDs
The patient cannot eat liquorice for at least 1 week before the test
The patient must be out of bed for at least 2 hours
The patient must be seated 5-15mins before the test
It’s unfortunately a screening test. The variation in renin levels, aldosterone levels and other biological factors make so it can be challenging. A study looking at 7150 participants in a meta-analysis shows that the pooled sensitivty was 81.6% and specificity was 93.3%. Therefore further testing is always warranted
The saline suppression test is the next step of care requiring the endocrinologist’s expertise.
I’ve had patients who do not wish to proceed with further testing at all. Having this knowledge to highlight to them what they would be in for if we discuss this pathway is really important for informed consent. I have a few patients with positive ARRs with hypertension in the 180s and 190s on three agents and then I introduce spironolactone where I titrate it to 200mg or more which leads to normotension and the removal of all of their agents.
Conclusion
Key points to remember are:
1 in 10 individuals with hypertension on average have a secondary cause
Secondary causes are more likely with certain factors – abrupt onset, <40y.o, hypertensive urgency/emergency, family history
Most common secondary cause is OSA > primary hyperaldosteronism > renovascular
Think about the clinical picture before diving into testing for cushing’s, pheo, coarctation and other rare causes
Transition to antihypertensives: verapamil SR + prazosin first >> moxonidine > hydralazine
Testing with ARR – beware of the sensitivity being ~80%
Patients can decline to go onwards to saline suppression test / surgical intervention and it would be appropriate to manage with spironolactone (which can go up to 300mg PO daily)
Funder JW, Carey RM, Mantero F, Murad MH, Reincke M, Shibata H, et al. The management of primary aldosteronism: case detection, diagnosis, and treatment: an Endocrine Society clinical practice guideline. J Clin Endocrinol Metab. 2016;101(5):1889-1916. doi:10.1210/jc.2015-4061
Kao TW, Chen JY, Liu JH, Tseng WH, Hsieh CC, Wu VC, et al. Diagnostic efficacy of aldosterone-to-renin ratio to screen primary aldosteronism in hypertension: a systemic review and meta-analysis. Ther Adv Endocrinol Metab. 2024;15:20420188241303429. doi:10.1177/20420188241303429
Siru R, Conradie JH, Gillett MJ, Page MM. Approach to the diagnosis of secondary hypertension in adults. Aust Prescr. 2021;44:165-9. doi:10.18773/austprescr.2021.038
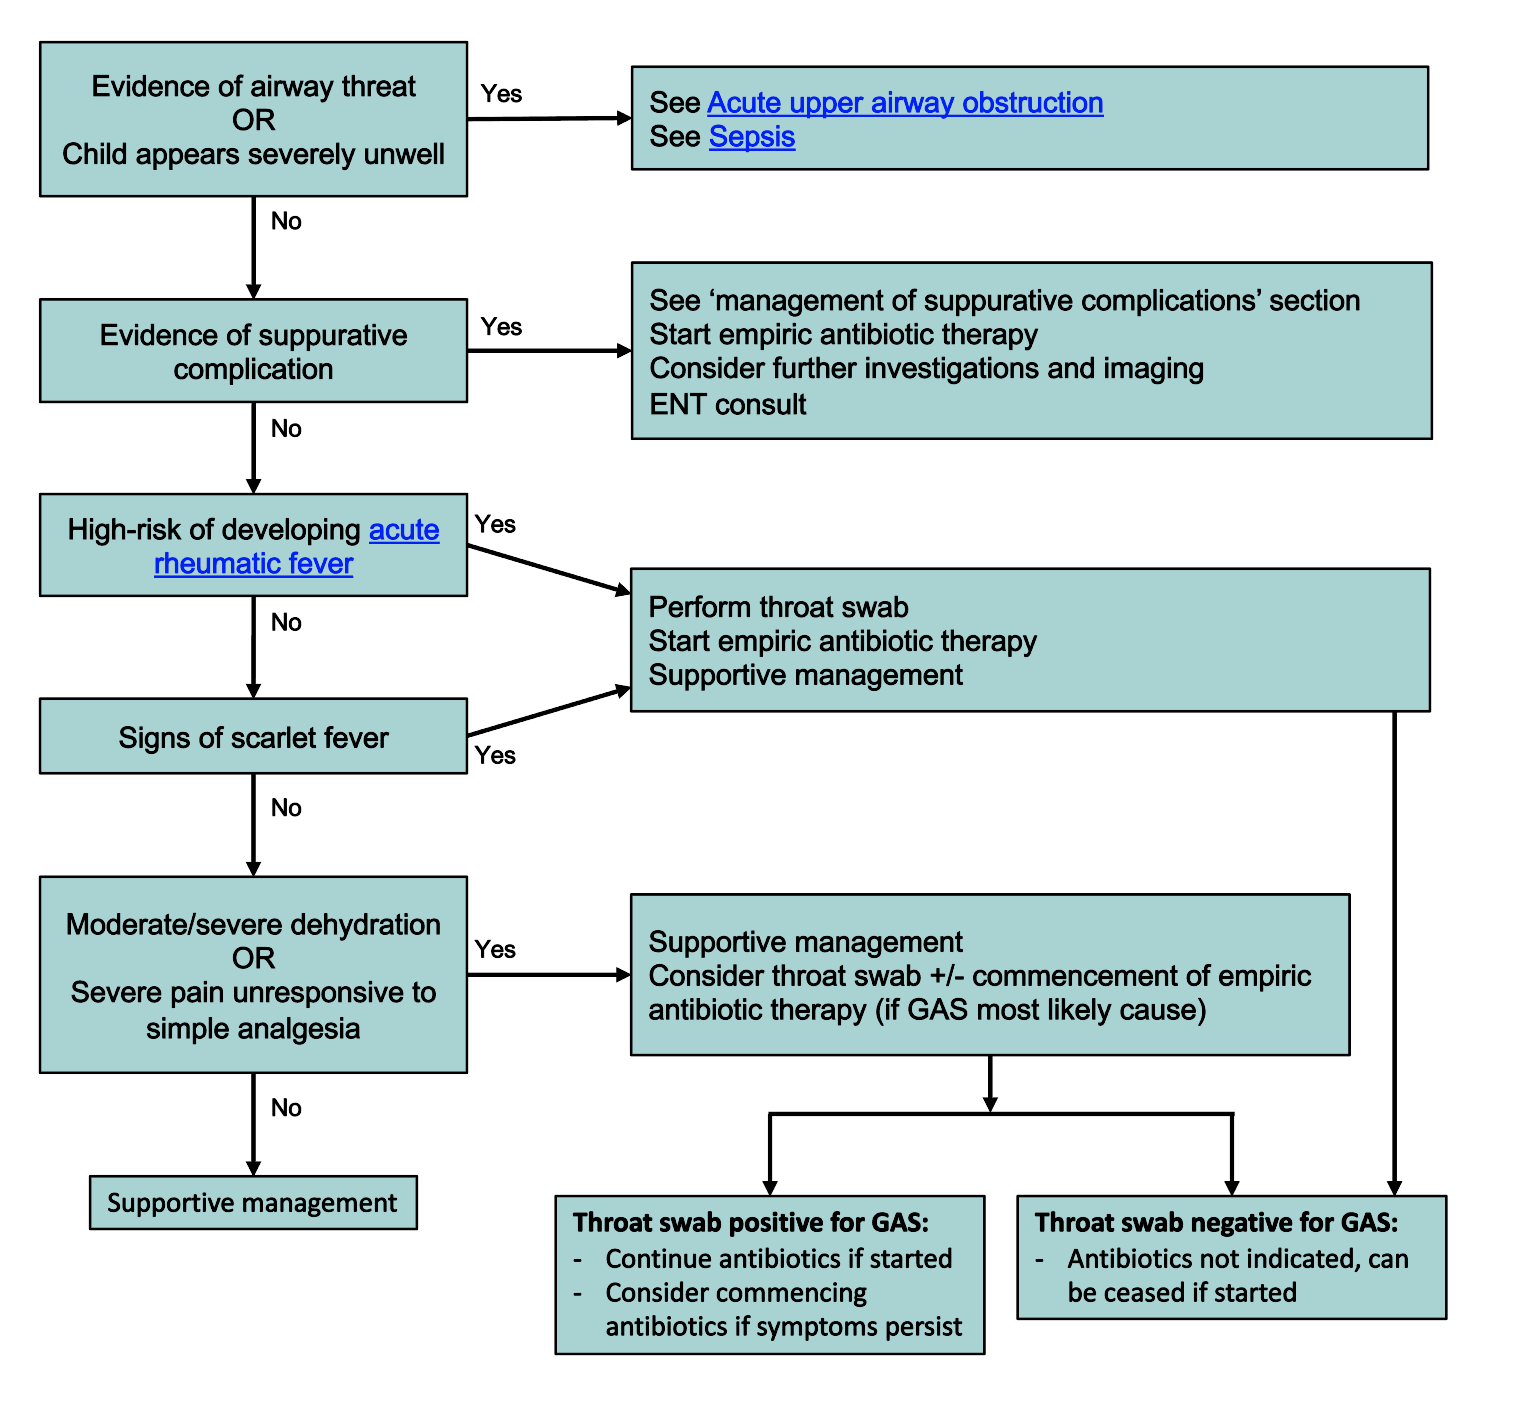
In General Practice we likely overdo it with antibiotic prescriptions in the setting of respiratory tract infections. There is more and more data to demonstrate that we actually do more harm to the patient providing antibiotics for respiratory tract infections and other common presentations to the General Practice. This is a combination of not only the potential adverse events that can occur but also increasing antimicrobial resistance is escalating all over the world where mult-resistant microbes are bullet proof against our arsenal of antimicrobials.
This post will be focused on looking at the evidence behind antibiotic use for patients presenting with a sore throat, what the benefits and harms are, and what strategies we can use as GP to reduce antibiotic use in non-indicated circumstances.
The sore throat
I’m going to be looking at Cochrane reviews for this one. Published in 2021, ‘Antibiotics for treatment of sore throat in children and adults’.
I think the Cochrane reviews are great. I think they provide reviews of the literature and provide robust, non-biased and informative deductions. This one looked at 15,337 cases from a total of 29 trials. A weakness of these studies of course is the majority of them took place in 1950, the sample size was insufficient to see if antibiotics reduced glomerulonephritis. It is worth noting that a reduction in symptom duration was sufficient: the number needed to treat to prevent 1 sore throat at day three was less than 6 and at one week it was 18. It certainly did reduce acute otitis media and quinsies within 2 months as well.
I hold a similar opinion to the conclusions of the author: we have to judge on an individual basis if there is likely a bacterial cause, balance the modest symptom reduction with antimicrobial resistance.
We know the two most common causes of sore throat are viral pharyngitis and viral tonsillitis. Another interesting study from the FRACGP (https://www1.racgp.org.au/ajgp/2018/july/sore-throat-in-primary-care) looked at the attitude we have towards sore throats. It’s really fascinating to see we still continue to push antibiotics for concerns around bacterial (specifically group A Streptococcus).
The current evidence through Therapeutic Guidelines, where they use quite robust reasoning and references, indicate that for patients without high risk of rheumatic heart disease in Australia routinely do not require antibiotics even if they have Group A Strep. There is limited evidence to suggest prevention of glomerulonephritis in the future. At best, we can reduce the symptoms of the illness by 1 day – but then all the risks of antibiotics come on board.
So the conclusion should be we should try to stop ourselves prescribing antibiotics in these circumstances where the patient is not high risk of acute rheumatic fever. Of course, if there is Scarlet Fever which then changes the approach. However, there’s no concrete evidence to show that antibiotics prevent scarlet fever but it does need 10 days of antibiotics to treat if present.
The Royal Children’s Hospital hold a similar view and we should hold off on antibiotics for children presenting with a sore throat without red flags. And I quote, “Group A streptococcus (GAS) is the most frequently implicated bacterial pathogen. It is usually self-limiting, difficult to distinguish from viral infection and empiric antibiotic therapy is not required for most patients”
Delayed antibiotic prescribing works! It reduces antibiotic use. It lets you keep rapport. It’s part of shared decision making – which is what we’re all about. Give the patient all the information we have above and let them weigh up the pros and cons. Although, I have to admit, I have been quite stern at times and refuse it outright because we also have a duty of care to the wider community with regards to antibiotic resistance for the future.
Another part of the care process we do not often highlight enough here as well is acknowledging parental concern and they worry for their kid. Highlighting that you want to do the right thing by their child too, and that you know they want their kid to get better and improve quickly so they’re not suffering. You don’t want to cause more problems with side effects because you know parents worry about that too. These make us less appear less cold and calculating.
Conclusion
Shared decision making and providing the data plus facts for patients is the way to go. If we want to reduce antibiotic prescribing we need to spend more time educating our patients about the benefits and harms of antibiotics so that they can make an informed decision about their care or their child’s care.
Apolipoprotein B (ApoB) has emerging evidence as the marker to predict the risk of cardiovascular disease for primary prevention. Systematic reviews and meta-analyses released in the last few years demonstrate it is a valuable tool we can use in Australian General Practice.
At this stage, the General Practice in Australia has not yet adapted it into routine clinical practice. I anticipate this will change in the next few years. At the moment the test is private but I do think that it will potentially become medicare-rebatable. The question then remains is when would it be indicated: is it going to fall into the recommendation of using it alongside total cholesterol to HDL ratio for risk stratification in the AusCVDRisk calculator, or is it going to be indicated in select circumstances?
This post will explore the basic pathophysiology behind ApoB, review the meta-analyses out there and formulating what I think how ApoB will be used for primary prevention based on the evidence presented.
Basic Pathophysiology and Lipid Profile Testing
Cholesterol is transported in the blood stream through he use of lipoproteins – this is because cholesterol is not hydrophilic (that is it will not dissolve in water) and the lipoproteins enable this dissolution. These lipoproteins include HDL, IDL LDL, VLDL, lipoprotein A and chylomicrons (which contain triglycerides). The size of these lipoproteins can vary – this is a very important point to remember for later when we talk about LDL, LDL-cholesterol and ApoB together.
ApoB is a lipoprotein that is synthesized by the liver. It is a protein that is attached onto these lipoproteins: specifically VLDL, IDL, LDL and lipoprotein A. It is important to note here HDL does not have ApoB at all. Each lipoprotein has a single ApoB attachment on it
What we know about ApoB is that it is very atherosclerotic in nature: the Journal of the American Heart Association published a review article encapsulating the mechanisms of how ApoB works in 2022 (https://doi.org/10.1161/JAHA.122.025858). ApoB loves to deposit itself and becomes trapped in the arterial walls – this is the key driver of atherosclerosis, not the lipoprotein itself. Increasing amount of ApoB particles in the blood stream proportionately increases the risk of cardiovascular disease.
Key message so far is more particles of lipoprotein (except HDL) in the plasma means more ApoB particles, which means increasing cardiovascular disease risk.
When we do a lipid profile, we get the following results: LDL-C, HDL-C, total cholesterol, TG and non-HDL cholesterol. The LDL-C is an indirect measurement based on the following formula:
LDL-C = Total Cholesterol – HDL-C – (Triglycerides / 2.2)
The triglyceride level is used to approximate the VLDL-C (triglycerides/2.2) level to get the LDL-C. The measurement here is mmol/L. Thus, escalating triglyceride levels means we cannot calculate the LDL. The equation can give us non-HDL totals by having TC – HDL-C levels (which becomes a combination of VLDL and LDL). So the LDL-C is an estimate – it’s not perfect. Then again, we are not using LDL-C anymore in our AusCVDRisk calculator and even then it’s a crude marker for “good” cholesterol versus “bad” cholesterol.
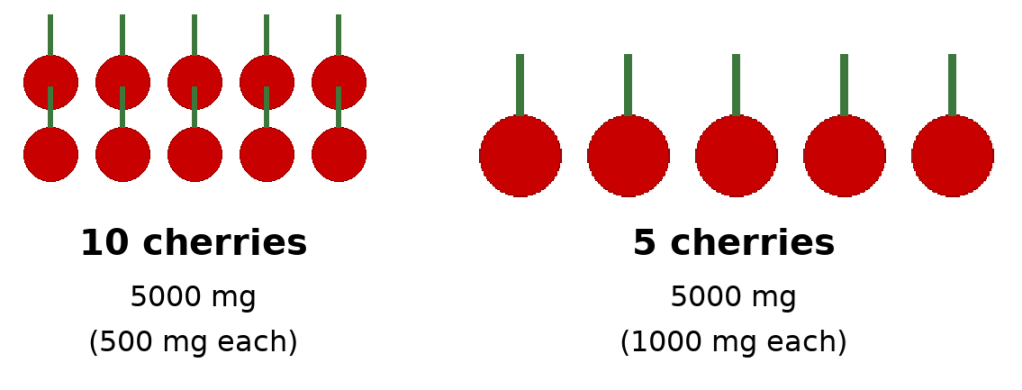
Imagine the following hypothetical. Person A has 10 cherries and each cherry weighted 0.5g. Compare that to person B who has 5 cherries that weight 1g. In both situations, you have a total weight of 5g but in the first instance there’s more cherries, meaning there’s 10 stems versus 5 stems.
Picture 1: cherries and stems – ApoB (stem) and LDL particles (cherries)
Using this perspective, each stem represents ApoB, and each cherry represents a LDL particle (remember each LDL particle can vary in size): although the total amount of weight of cherries (LDL-C) is the same in both situations, because the first situation has more LDL particles, and thus, more ApoB, the first situation has a higher atherosclerotic risk.
This there in lies the weakness of LDL-C as a measurement in how we do via the lipid profile: we get an indirect quantity of LDL-C and we can’t measure the number of LDL particles. This means we cannot measure ApoB which is the true driver of plaque deposition in the arterial wall. Using our prior model without ApoB, we would say the cardiovascular risk in both situations is the same. This is not correct and ApoB measuring is much more accurate.
The new testing we have available, with cost reducing over time, is a direct measurement of the ApoB molecule itself in the bloodstream – we can quantify the concentration (and thus the amount) therefore we can risk stratify better as we directly measure how many atherosclerotic cannonballs are out there.
ApoB and CVD risk stratification
Table 1: recent studies showing ApoB and it’s role in CVD primary prevention
Study (Year)
Type of Study
Population / Sample Size
Key Findings
Relevance for Primary Prevention
Katsi V et al., 2025The Role of Non-HDL Cholesterol and Apolipoprotein B in Risk Stratification and Therapeutic Targeting
Narrative review (biomarker foundations)
Population synthesis from multiple cohorts (>1 million individuals referenced across included studies)
ApoB & non-HDL-C outperform LDL-C across risk states, especially mixed dyslipidaemia & metabolic syndrome.
Shows ApoB’s superiority in real-world primary prevention settings where LDL-C underestimates risk.
Sehayek E et al., 2025, J Clin LipidolApoB, LDL-C & non-HDL-C discordance: Systematic Review & Meta-analysis
Systematic review (33 studies)
Total pooled population >500,000 individuals from primary & secondary prevention cohorts
ApoB is most accurate predictor when LDL-C/non-HDL-C discordant; treatment decisions should prioritise ApoB.
Key SR showing ApoB should guide therapy & risk categorisation in general practice.
De Oliveira-Gomes D et al., 2024, CirculationApolipoprotein B: Bridging the Gap Between Evidence and Clinical Practice
Expert translational review
Synthesises data from trials, cohorts, & MR studies (>1.5 million total participants represented)
Most clinically useful paper for how to incorporate ApoB into GP prevention workflows.
Sayed AH et al., 2024, JAMA CardiolDiscordantly Elevated ApoB in Adults With Normal LDL-C
Cross-sectional cohort study
12,688 statin-naïve adults (NHANES)
20–30% had high ApoB despite normal LDL-C; these individuals had higher predicted ASCVD risk.
Demonstrates how LDL-C misses risk → supports once-off ApoB for primary prevention.
Sniderman AD et al., 2024, Eur Heart JApoB vs LDL-C Discordance in UK Biobank
Large prospective cohort
293,876 adults, 11-year median follow-up
When discordant, risk follows ApoB, not LDL-C.
Excellent for reclassifying patients in intermediate ACVDR categories.
Yang J et al., 2023, JAMA Network OpenDose-response Mendelian Randomisation of Lipids
Mendelian-randomisation study
~440,000 UK Biobank participants
ApoB has strongest causal relationship with CAD & mortality vs LDL-C or TG.
High-quality causal evidence → ApoB is the true biological driver of first ASCVD events.
Glavinovic T et al., 2022, J Am Heart AssocWhy ApoB Is Superior to LDL-C and non-HDL-C
Mechanistic + narrative evidence synthesis
Population mechanisms based on large cohort data (e.g., INTERHEART, UKBB; >200k represented)
Demonstrates physiologic basis: atherogenic particle number (ApoB) causes plaque, not LDL-C mass.
Helps explain to clinicians/patients why ApoB should be measured even with “good LDL-C.”
Khan SU et al., 2020, Eur J Prev CardiolSystematic Review of RCTs: ApoB-lowering & CV Outcomes
Meta-analysis of 29 RCTs
~333,000 participants
Every 10 mg/dL reduction in ApoB → 7–12% reduction in MACE.
Direct evidence that treating to lower ApoB improves outcomes.
Large population-level meta-analyses (pre-2020) (e.g., Emerging Risk Factors Collaboration analyses)
Systematic review/meta-regression
Cumulative population in hundreds of thousands
ApoB stronger predictor than LDL-C in multiple pooled cohorts.
Lays foundation behind ApoB’s adoption by cardiometabolic prevention groups.
Sniderman AD et al., 2019Apolipoprotein B particles & ASCVD risk
Narrative review (expert synthesis)
Synthesises major datasets (>1 million across cited cohorts)
Early consolidation showing ApoB > LDL-C globally.
Background reference showing longstanding consistency of ApoB evidence.
We can confidently say that the pathophysiological basis of atherosclerosis from ApoB is translated into the data we see repeated in the studies. I have provided a table that summaries key articles I have identified and the key messages to take away from them
What does that mean for us in general practice in Australia?
If we look at how the AusCVDRisk calculator works I suspect ApoB will help stratify further for thinking about life time risk as it’s role is to build plaque. The challenging thought is how is this going to be incorporated into the CVD risk calculator? It could potentially be the next step after the AusCVDRisk calculation and become the following
Table 1: ApoB concentration and using it to adjust AusCVDRisk %
ApoB band
Apply multiplier to ACVDR %
Reason
<0.8 g/L
ACVDR × 0.7
Lower observed events in low-ApoB phenotypes
0.8–1.2 g/L
ACVDR × 1.0
ACVDR fairly accurate
>1.2 g/L
ACVDR × 1.5–1.7
HR ~1.4–1.75 consistently reported
If we’re thinking relative to the CT calcium score scan, I think ApoB is better for thinking far in the future whereas the calcium score will let us know how much plaque there already thus guide us more definitively in the next few years.
There will be more nuance here I suspect once it rolls out in deciding what to do with the intermediate risk factors with the use of ApoB versus CT calcium scoring.
For patients who have statins commenced then the question becomes what should be measure? The data is pointing towards ApoB and depending on the risk patients are either going to be pushed to be <0.8 for those are high risk and <1.0 if in other risk categories. What we see is LDL declines in parallel with ApoB – not unsurprising given a LDL particle has an ApoB particle.
Summary
ApoB is the way forward in measuring CVD risk for primary prevention and will guide management in the future
ApoB itself is a direct promoter of atherosclerosis – it glues lipoproteins/cholesterol into the arterial walls causing plaque formation over time.
Our current lipid profile testing is a crude estimate of “good” versus “bad” cholesterol providing a less precise estimate of a person’s CVD risk in the primary prevention setting.
ApoB testing can directly calculate the particles circulating in a person’s blood stream via concentration of it and this can direct risk based stratification better
Table 1 is what I suspect the future use of ApoB to be based on the clinical data.
Future guidelines will likely advocate for ApoB < 0.8 for high risk individuals if treating with statins and <1.0 for the lower risk individuals.
This changed when I was undertaking my training in 2023 where new recommendations were made where the Framingham equation was replaced with the newer AusCVDRisk Calculator for primary prevention.
There is some nuance to risk assessment. The pathway can be very algorithmic in nature.
What I want to examine is the evidence behind it, what are the advantages and disadvantages we have, what do you do for the grey area and where to from here?
Note: if this is too much waffle, I have put a summary at the end
The Framingham Risk score – old and discarded
This was the tool used previously in Australia. The origin of it is a epidemiological cohort study that continues on from 1948 in Framingham, Masschusetts, USA. It continues today with its most recent tool for CVD risk stratification; the 2018 Prevention Guidelines Tool CV Risk Calculator. The Americans use it. We don’t anymore.
This tool enables us to estimate the 10-risk and lifetime risks of cardiovascular disease (specifically atherosclerotic of course).
The disadvantage of this tool is as follows:
USA data (we’re Australians and we have drop bears
Primarily used for coronary heart disease (mainly myocardial infarction) where peripheral vascular disease and stroke were not taken into account as much
it does not take into account chronic kidney disease markers
What is interesting is they also have a 30 year calculator as well which I do not think we have much teaching on nor do we think much about this. This calculator uses a study that followed 4506 participants (which half were women) that did not have cardiovascular disease from 1971 to 1974 and examined the variables involved. The predictors of heart disease remain the same and overall I don’t think I would be advocating for its use. I think it’s a niche tool that can be used if a patient is really motivated to make changes and see their data: for clinical decision making I wouldn’t rely on it at all.
AusCVDRisk Calculator – behind the scenes
This tool was developed for the Australian population where the National Heart Foundation of Australia was contracted by the Department of Health and Aged Care.
If you get the appendix and the individuals involved boy oh boy it’s robust. You have leading experts in multiple fields including epidemiology, endocrinology, cardiology and more.
They are also very transparent in how decisions were made based on evidence-based medicine and they even grade the certainty of evidence.
They even leaned on our neighbouring New Zealander’s cohort study on CVD through the utilization of their NZ PREDICT-1 equation (if you’re interested have a look here https://www.vareanz.auckland.ac.nz/predict1-riskscores/)
Overall, it’s quite solid in what it delivers for primary prevention.
The key issue I have with it it’s a 5 year predictor. I imagine over time the data generated from the Heart Foundation Australia will give us a tool to stretch it more into the future. To address this weakness it asks us the GP to reassess risk at 5 year intervals for low risk, and lower for the intermediate and high risk patients. There’s a few more issues which I will go into more in depth later.
AusCVDRisk Calculator – the meaty bits
When confronted to the calculator to use for a patient it’s taking into account multiple variables that we know are linked with CVD. It also takes into account the postcode – ever won a postcode lottery? Live in Toorak. Socioeconomic disadvantage is taken into account. Key risk factors are noted.
The disadvantages are laid out as well with reclassification factors – family history, certain ethnicities, and highlighting that patients with certain other health issues.
Now, to summarize briefly their recommendations: low risk = lifestyle modifications only, medium risk = lifestyle +/- meds, high risk = definitely recommending medications.
There’s people with cholesterol >7.5 total and LDL > 5.0 or CKD Stage 3b or lower who automatically get high risk as well. There’s studies in the past for the cholesterol parameters that I dug up and they found these points were cut offs where the CVD risk became high (3-4x higher): this included the Framingham Heart Study, the INTERHEART study and the Copenhagen City Heart Study. Don’t forget the familial hypercholesterolaemia cohort as well.
For chronic kidney disease stage 3b or lower, four big studies (Go et al, NEJM 2004;351:1296-1305), (Chronic Kidney Disease Prognosis Consortium, Lancet), (Fox et al, NEJM 2012;367:240-249) and (Matsushita et al, Circulation 2020;141:1242-1254) all demonstrate increasing CVD risk with declining renal function. The key point of definitely intervening is stage 3b, but you can argue 3a as well (which the ACVDR takes into account).
This is the first point of nuance to consider.
Ethnicity – Maori, Pacific Islander or South Asian ethnicity
Family history of premature CVD – males < 55, females < 65 (first degree)
Chronic kidney disease – getting closer to 3a increases risk. it also goes into A2 or A3 as markers of higher risk as well.
People living with severe mental illness – I think we also under-appreciate this and often get lost in the forest of managing their mental health.
This area I find tricky if the patient overall is low risk with these factors. What do I do then? Do I reclassify them to intermediate risk? Is this intermediate risk equivalent to a person who doesn’t have these factors but simply due to their age and normotension at 130 with a ratio of cholesterol of 5? Should I start the person on medications?
My default position becomes could this patient then benefit from a CT coronary calcium score for more risk stratification if they fall into the intermediate zone or low risk with concerning features such as family history. Which then follows a similar line of thinking with what is their calcium score and then low risk, intermediate risk and high risk. I’ll write more on this topic in another article.
So the answer is clear if the patient is low risk and no other factors or high risk which means straight onto medications. I won’t dive into the high risk area as much in my discussion.
AusCVDRisk Calculator – the intermediate risk zone
So why is it the recommendations say consider this area a discussion with the patient?
Table 1: Primary Prevention Trials in Intermediate Risk
Study
Population
Baseline 5-Year Risk
Key Findings
Reference
JUPITER (2008)
17,802 adults with LDL <3.4 mmol/L and hs-CRP ≥2 mg/L
Mean ≈ 7%
Rosuvastatin 20 mg daily reduced MI, stroke, and CV death by 44% RRR; ARR ≈ 1.2%, NNT = 83/5 years
Ridker PM et al. NEJM 2008;359:2195-2207
HOPE-3 (2016)
12,705 men ≥55 y / women ≥65 y with ≥1 risk factor
Median 5-year risk ≈ 8%
Rosuvastatin 10 mg ↓ CV events by 24% RRR; ARR ≈ 1.1%, NNT = 91/5 years
Yusuf S et al. NEJM 2016;374:2021-2031
ASCOT-LLA (2003)
Hypertensive, non-diabetic adults, mean cholesterol 6 mmol/L
~10%
Atorvastatin 10 mg ↓ non-fatal MI/fatal CHD by 36% RRR; ARR ≈ 1.1%, NNT ≈ 91/5 years
Sever PS et al. Lancet 2003;361:1149-1158
WOSCOPS (1995)
Men with moderate hyperlipidaemia, no CVD
≈ 9%
Pravastatin ↓ CHD by 31% RRR; ARR ≈ 2.4%, NNT = 42/5 years
Shepherd J et al. NEJM 1995;333:1301-1307
Table 2: Meta-analyses Supporting Benefit Across Risk Bands
Analysis
Risk Groups Studied
Result Summary
Reference
CTT Collaboration 2012
27 RCTs, 134 000 participants
Every 1 mmol/L LDL reduction = 25% RRR in major vascular events across all baseline risks. For 5-year risk < 10%, ARR ≈ 1–2% (NNT ≈ 50–100)
Lancet 2012;380:581-590
Mihaylova et al. 2012
Pooled > 175 000 participants
In primary prevention, for each 1 mmol/L LDL ↓, 22% fewer major vascular events; mortality reduction appears from baseline 10-year risk > 7.5%
Lancet 2012;380:581-590
Naci et al. BMJ 2013
29 trials, 80 711 pts
NNT ≈ 49 for all-cause mortality over 5 years in moderate-risk primary prevention
BMJ 2013;347:f6123
Silverman et al. JAMA 2016
49 RCTs, 312 000 pts
Statin use in intermediate risk lowers CV events (RR 0.73) and all-cause mortality (RR 0.91)
JAMA 2016;316(19):1975-1989
There’s probably more studies out there but overall, what we can see is statins, if introduced, has a relative risk reduction of about 25% irrespective of the risk.
So why not automatically put it for everyone in intermediate risk? Why only reserved for higher risk individuals?
Another way to think about it is what is the number needed to treat to stop 1 cardiovascular event over 5 years? For intermediate risk it’s around 42-91 depending on which study you use above.
I have to treat close to 100 patients to stop 2 cardiovacular events at best and at worst 1 cardiovascular event. We can see for high risk people the number of events we prevent becomes higher per 100 people treated and thus the default position is to treat. So this is a modest reduction
Tricky isn’t it? I mean we can argue stopping 2 heart attacks out of 100 people treated on statin is beneficial of course, but we also need to think about the number needed to harm with statin therapy. The harms of statin therapy if we look at the numbers is muscle associated side effects (around 1 in 20). What is important to note as well is a randomized large-scale clinical trial demonstrated that statins have a dose dependent effect on worsening hyperglycaemia in patients (note it is SMALL, and there is still a reduction in cardiovascular risk overall with this tiny increase risk); effects of statin therapy on diagnoses of new-onset diabetes and worsening glycaemia in large-scale randomised blinded statin trials: an individual participant data meta-analysis
So if patients are in the intermediate zone I think I would be inclined to say there’s a 25% reduction in cardiovascular events and based on your risk a NNT is somewhere between 42-91, probably a much narrower range if we dig up more studies, but it’s not mandatory. The ACVDR evidence digs into this a lot as well. Of course, it’s the patient’s decision but we can use this to help them make decisions accordingly to reduce their risk of heart disease. Would I put these patients on statins by default? I let the patient make the decision and I steer them to make lifestyle changes because that will improve not only their cardiovascular disease risk but their overall wellbeing and health.
Aspirin follows a similar line of thinking with NNT and NNH – unfortunately the numbers are so close together can we really argue it’s beneficial? Even at high risk individuals it’s still a tricky line to consider.
This was a bit of a rant but I needed to look at the data myself to convince myself the ACVDR consensus that it’s a discussion rather than push medications immediately is reasonable. Even looking at the intermediate risk data, you get insight into why it is then that you treat for high risk individuals and not treat for low risk individuals. It’s all down to the NNT. But don’t forget NNH
What about low CVD risk? Should we treat with a statin?
I think we have been a bit trigger happy with statin prescriptions to stop CVD – it is up there in mortality. It comes down to the practitioner who prescribed them facing the number and going any LDL > 2.0 is unacceptable and over-estimating the benefit statins have to prevent harm from CVD.
If the LDL > 5.0 or total chol is 7.5 then the evidence indicates the 2.5-3x risk of CVD makes it unacceptable to not offer statin therapy for these individuals – don’t forget the familial hypercholesterolaemia patients either who fall into this.
This is an opportunity to try and identify the patient’s motivational level of change and try to get them to make goals to change their lifestyle factors.
I found the resource theNNT.com quite helpful to look at. For persons at low risk of cardiovascular disease, with the references and resources they used, they have demonstrated there is no statistically significant mortality benefit if we treat with statins. You need to treat about 200 people to avoid 1 non-fatal myocardial infarction and about 300 people to avoid 1 non-fatal stroke. Talk about inefficient. Don’t forget NNH as well with the slight increased amount of hyperglycaemia and muscle related side effects we discussed earlier.
What other tools do we have?
Apolipoprotein B, lipoprotein(A), polygenic risk scores (so genetic variant testing) and inflammatory markers (hs-CRP in particular potentially with others showing some promise such as GDF-15, suPAR and IL-6) will have roles in the future.
We already see Canadian guidelines emerging for ApoB and other countries as well. I will most likely look into this as I imagine in a few years, up to 5, this will soon be incorporated into Australian General Practice. For now, I know of colleagues who are already diving into testing these factors and managing patients using them.
Conclusions
The new way forward for Australian patients for primary prevention of CVD is to use the AusCVDRisk Calculator
Key risk factors to not forget:
increasing CVD risk with declining renal function – progressive stages and progressive albuminuria increases risk, with stage 3b or lower making it automatically high risk
Familial hypercholesterolaemia – don’t forget this
First Nations people – unfortunately disproportionately higher rates of mortality and morbidity from multitudes of conditions
Maori, Pacific Islander or South Asian ethnicity
People living with severe mental illness – you have seen these patients on multiple psychotropes, don’t get lost in the forest of managing their mental health and take a step back to see the whole area
Family history of CVD
Intermediate risk individuals
Challenging situation
Being aware of the above variables will guide decision alongside the patient’s BP and chol profile
The reduction in CVD is modest here (NNT from above around 41-92) looking at the studies but if multiple risk factors, not accounted for by the AusCVDRisk calculation, are present then I would be more inclined to treat especially if the risk is closer to high risk than low
The CT calcium score can be used here – I’ll write more about this separately
Don’t forget lifestyle modification – assessing motivational stage of change and guide the patient to making their own goals to meet to improve their health
Low risk CVD patients, without severe hypertension and TC < 7.5 and LDL < 5.0 or risk factors do not benefit from statin therapy – there’s no reduction in mortality, the NNT is very high for preventing a non-fatal MI or stroke.
I have not discussed too much about antihypertensives but we know >160 should have one recommended as higher is unacceptable risk. Follows similar thought train with NNT and NNH for intermediate risk.
The purpose of this blog is to use it as a dumping ground for my thoughts and experiences in Australian General Practice. I want to use it as a platform to dive deep into not only evidence based medicine but also the challenges we face as GPs working with people and how we navigate through challenging consultations.
I also want to use it as a space for registrars to read up on things as they go through their training. Although there are resources out there for registrars to use to prepare for exams I want to use this platform to bring attention to difficult consultations such as medically unexplained symptoms, managing patient expectations and the emotional challenges we face as clinicians.
 Primary Intentions